Your funnel loses 75% of prospects before a showing. Here’s the fix.
- AI agents respond to every inquiry 24/7 — phone, email, chatbot, Facebook Messenger — so no lead ages past the response window
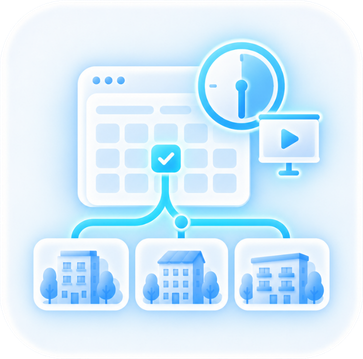
- Qualified prospects self-schedule showings directly based on your availability, no back-and-forth required
- Stage-by-stage conversion dashboards show exactly where your funnel leaks — by property, not just portfolio aggregate
- One unified pipeline captures leads from every channel into a single record, so nothing falls between systems
Multifamily Leasing Funnel Stages Most Teams Track Incorrectly
Four Stages Drive Every Lead-to-Lease Outcome
Most multifamily portfolios convert roughly 10% of inquiries from prospects planning to move within the month into signed leases, per RentViewer’s multifamily funnel benchmarks. That number drops to between 5% and 6.7% for prospects with two- to three-month move-in timelines. The drop-off happens across four distinct stages: inquiry to showing, showing to application, application to approval, and approval to signed lease. Most operators cannot identify which stage loses the most prospects without stage-level tracking in place. If you manage 100 or more units and only track total leads versus total leases, you are operating with a significant blind spot. Explore how multifamily property management at scale addresses this visibility gap.Inquiry-to-Showing Rates Signal the First Major Loss
The first stage converts an inquiry into a scheduled showing. Most large portfolios lose most applicants at this stage. Multifamily properties convert just 25% of phone or text inquiries into property showings, per RentViewer’s inquiry-to-showing rate benchmark. That means three out of every four prospects who picked up the phone or sent a message never set foot in a unit. Most leasing reports do not surface this number. They count leads at the top and leases at the bottom. The four stages between inquiry and lease stay invisible. Once a prospect does schedule a showing, the funnel converts a higher percentage of prospects to the next stage. 40% of showings produce a submitted application, and 70% of approved applications convert to signed leases. The math is not evenly distributed across stages. The showing stage is where the highest conversion leverage exists, and it is the stage most operators underinvest in fixing.Leasing Teams Often Lack Stage-Specific Visibility
Here is the operational trap that catches large portfolios specifically. The more properties you manage, the more data you generate. Volume makes operators believe they have stage-level insight when they do not. Remarkably found that more data in multifamily management does not automatically provide more analytical power without proper processing into actionable insights. Raw Property Management System (PMS) exports, Internet Listing Service (ILS) lead counts, and Customer Relationship Management system (CRM) contact volumes tell you what happened. They do not tell you at which stage applicants stopped moving forward. They do not explain why. A guest card is the prospect record that tracks a renter through each funnel stage. Stage-level conversion tracking requires a single unified guest card for every prospect that follows them through all four stages without breaking the chain. That guest card must record the outcome at each of the four stages: inquiry, showing, application, and approval.Does Your Portfolio Track the Right Funnel Stages?
Before diagnosing where your funnel leaks, check whether your current infrastructure can even detect a leak. The average multifamily portfolio converts 8.7% of guest cards to signed leases, per MyResman’s guest-card-to-lease conversion data. If you cannot verify your own rate against that benchmark right now, your tracking has a gap. Run through the checklist below.- Your leasing software records a separate conversion rate for inquiry-to-showing — not just total leads — and you can pull that number by property. (Benchmark: 25% per RentViewer)
- You track showing-to-application rate at the individual property level, not only as a portfolio aggregate. (Benchmark: 40% per RentViewer)
- Your CRM creates one unified guest card per prospect, capturing phone, email, ILS, and walk-in inquiries in a single record.
- You know your approval-to-lease close rate and have compared it to the 70% industry benchmark in the last 90 days. (Benchmark: 70% per RentViewer)
- Your reports separate near-term move-in prospects (under 30 days) from longer-timeline prospects (60–90 days). Those two groups convert at materially different rates.
- Your leasing team reviews stage-level funnel data at minimum monthly — not just total leases signed per period.
- You can identify which funnel stage has the widest gap versus the industry benchmark within 24 hours, without pulling a custom report.
Lead Source Data Shifts Where Operators Should Focus First
Three Channels Produce 83% of Signed Leases
Before you can fix conversion, you need to know where your signed leases actually originate. Rentvision analyzed over 95,000 signed leases and found that community websites, Google Business Profiles, and Google Ads account for 83% of all signed multifamily leases. That is not a marketing hypothesis. It is a large-sample outcome from actual executed leases. You can explore how rental property advertising across channels affects this distribution for managed portfolios. The implication is clear: most operators already have the lead sources producing nearly all of their leases. The question is not where to find more leads. It is why so few of the existing leads are becoming leases.More Lead Volume Does Not Fix a Conversion Problem
Most large multifamily operators assume that signing more ILS contracts or increasing paid ad spend is the primary lever for increasing leases signed. But RentViewer found that only 25% of inquiries convert to property showings. That means 75% of prospects who contacted a property never scheduled a visit. The bottleneck sits in the middle of the funnel, per RentViewer’s funnel conversion data. That bottleneck is not at the top. Operators losing three-quarters of contacts before a showing are converting fewer prospects than new inquiries can replace. Improving stage conversion is the fix. Increasing stage input is not.The Gap Between Average and Top-Performing Portfolios
According to MyResman’s leasing funnel analysis, top multifamily properties achieve a 16.5% conversion rate from guest card to signed lease. The portfolio average sits at 8.7%. That near-doubling of performance is not explained by access to better lead sources. Both groups draw from the same channels. The difference lives entirely in how efficiently each group moves prospects from one stage to the next. Efficiency at each stage means a higher percentage of prospects advance to the next stage rather than dropping off. If your portfolio tracks total leads and total leases but nothing in between, you have no mechanism to close that gap. You cannot see where it opens.Google Business Profiles Deserve More Operational Attention
When three channels drive 83% of leases and two of them are owned or low-cost assets, systematically under-managing them is a quantifiable mistake. Yet most large portfolio operators allocate operational resources to ILS management and treat Google Business Profile maintenance as a one-time setup task. Forbes Business Council’s analysis of multifamily centralization myths found that structural improvements in lead handling apply to portfolios of all sizes. Those improvements require changes in team structure as much as technology. Treating owned channels with the same operational rigor as paid channels is one of those changes.Inquiry-to-Showing Conversion Determines Most Leasing Outcomes
Prospects Who Tour Are 63% More Likely to Sign a Lease
Think of the showing stage as a valve, not a step. When it opens, a predictable percentage of applicants flow through to a signed lease. At a 25% showing rate, it stays mostly closed. Every downstream stage then works with a fraction of its prospect pool. That fraction is the ceiling on your total leases signed. MyResman found that prospects who complete a tour are 63% more likely to sign a lease than those who do not. Combine that uplift with the 25% showing rate and a pattern emerges. The showing stage is not just a step in the funnel. It is where most of the difference between a signed lease and a lost prospect is determined. Optimizing the application stage before fixing the showing stage is solving the wrong problem first.Self-Scheduling Removes the Friction That Kills Showing Rates
What stops a prospect from scheduling a showing after an inquiry? In most cases, it is friction: a phone tag cycle, an email with no reply, or a leasing office unreachable during business hours. The prospect is at work when the office is open. Raintree Partners addressed this directly with Knock CRM. The outcome was measurable: prospects self-schedule 70% of tours at Raintree properties, per RealPage’s Raintree Partners case study. Self-scheduling eliminates the response lag that causes most pre-showing drop-off. When a prospect can book a tour at 10 pm from a phone, the 25% showing rate has room to move. Every percentage point it moves has a downstream effect on applications and leases. A showing scheduler for rental properties applies the same principle at the portfolio level.Slow Response Times Drive Most Pre-Showing Drop-Off
Speed of response after an inquiry is not a customer service metric. It is a funnel metric. Slow response reduces the inquiry-to-showing conversion rate. That rate determines how many prospects enter the rest of the funnel. A prospect who submits an inquiry form at noon and receives a response the next morning has already compared three other properties overnight. That pre-showing drop-off is not random. It is the predictable result of response latency in leasing teams managing dozens of active leads across multiple properties simultaneously. Funnel Leasing’s analysis of AI leasing impact found that 77% of multifamily executives report moderate or significant operating expense reductions through AI leasing solutions. That finding reflects AI’s role in maintaining consistent response speed regardless of inquiry volume or time of day.One AI Agent Can Manage Leads Across 50 Properties
The economics of human response at scale make the 25% showing rate almost inevitable without automation. A leasing agent managing five properties cannot respond to every inquiry within minutes across all five. Funnel Leasing found that AI enables one agent to manage leads for up to 50 multifamily properties by handling context switching and administrative tasks automatically. For a portfolio operator managing 200, 500, or 1,000 units across multiple sites, this changes the structural cost of maintaining rapid response. Human agents focus on prospects who need judgment. AI handles the volume that previously fell through the gap between inquiry and scheduled showing.Four-Stage Funnel Leak Diagnostic for Large Portfolios
Funnel Math Reveals Where the Average-to-Top Gap Is Created
Run the numbers on a hypothetical 500-unit portfolio to see exactly where the performance gap between average and top-performing properties is manufactured. At the average conversion rate, that portfolio generates roughly 8.7 leases per 100 guest cards created. The RentViewer stage benchmarks map the path: 25% inquiry-to-showing, 40% showing-to-application, 70% approval-to-lease. Applied to 100 inquiries: 25 showings, 10 applications, and roughly 7 signed leases after the approval stage. Approval-to-lease conversion of 70% is documented, per RentViewer’s stage-level funnel data. While RentViewer benchmarks an average 10% end-to-end conversion for near-term prospects, MyResman’s data shows top-performing multifamily properties achieve 16.5% guest-card-to-lease conversion. That is nearly double the 8.7% average, per MyResman’s leasing funnel analysis. That gap is not created at the approval stage, where the industry already converts at 70%. It is created at the inquiry-to-showing stage, where the variance between average and top performers is largest.The Four-Stage Leak Diagnostic Framework
Apply this framework to your own portfolio data. Each stage has a named benchmark, a symptom of underperformance, and a specific intervention.- Stage 1 — Inquiry to Showing (Benchmark: 25%). Symptom: Your showing rate is below 20%. Intervention: Implement self-scheduling so prospects can book tours without waiting for a callback. RKW Residential reduced lead-to-lease time by 52% using VERO, a leasing application and approval platform, per SayVERO’s case study on mid-market property managers. Process speed at any stage produces measurable funnel compression.
- Stage 2 — Showing to Application (Benchmark: 40%). Symptom: Prospects tour but do not submit applications within 48 hours. Intervention: Send a follow-up with a direct application link within two hours of the showing, before competing properties reach the same prospect.
- Stage 3 — Application to Approval (Benchmark: varies by screening process). Symptom: Applications sit in queue for more than 48 hours. Intervention: Automate screening triggers so applications move to review immediately upon submission rather than entering a manual queue.
- Stage 4 — Approval to Signed Lease (Benchmark: 70%). Symptom: Approved applicants go dark before signing. Intervention: Deploy a move-in incentive at the point of approval. Incentives offered at the point of approval have the highest conversion impact when a prospect is actively deciding.